Real-Time ROCm GPU Monitoring with Web Dashboard
A lightweight Go-based tool for monitoring AMD GPUs with ROCm, featuring a web dashboard, REST API, and Prometheus metrics.
SmartTechLabs
SmartTechLabs - Intelligent Solutions for IoT, Edge Computing & AI
The Problem
When running AI workloads on AMD GPUs with ROCm, visibility into GPU performance is essential. While rocm-smi provides command-line access to GPU metrics, we needed something more:
- Real-time monitoring without constant terminal polling
- Integration with existing observability stacks
- A clean web interface for quick status checks
Introducing rocm_info
We built strix-halo-rocm_info, a lightweight monitoring tool written in Go that exposes ROCm GPU metrics through multiple interfaces.
Architecture
┌─────────────────┐     ┌──────────────────┐
│   rocm-smi      │────▶│   rocm_info      │
│   (ROCm CLI)    │     │   (Go Service)   │
└─────────────────┘     └────────┬─────────┘
                                 │
                    ┌────────────┼────────────┐
                    ▼            ▼            ▼
              ┌─────────┐  ┌─────────┐  ┌─────────┐
              │   Web   │  │  REST   │  │Prometheus│
              │Dashboard│  │   API   │  │ Metrics  │
              └─────────┘  └─────────┘  └─────────┘
Features
| Feature | Description |
|---|---|
| Web Dashboard | Real-time GPU status visualization |
| REST API | JSON endpoints for programmatic access |
| Prometheus Metrics | /metrics endpoint for Grafana integration |
| Lightweight | Single Go binary, minimal resource footprint |
| Strix Halo Support | Tested on Ryzen AI Max 395 (gfx1151) |
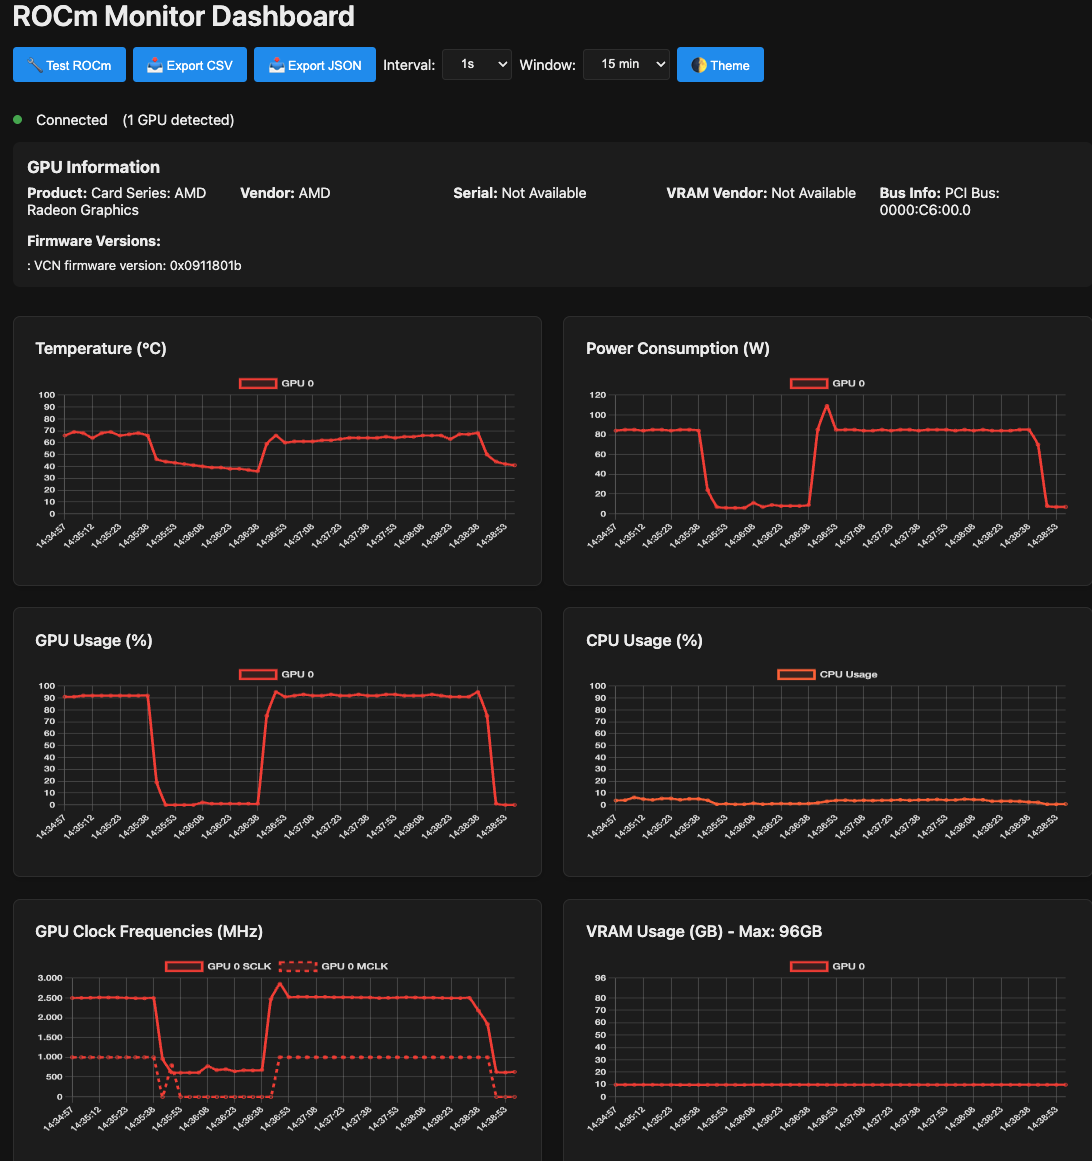
Metrics Exposed
The tool captures key GPU metrics:
| Metric | Description |
|---|---|
| Temperature | GPU core temperature |
| Utilization | GPU compute usage percentage |
| Memory | VRAM usage and availability |
| Power | Current power draw |
| Clock Speeds | GPU and memory frequencies |
Quick Start
| |
Access the dashboard at http://localhost:8080 and Prometheus metrics at http://localhost:8080/metrics.
Prometheus Integration
Add to your prometheus.yml:
| |
Then create Grafana dashboards to visualize GPU performance alongside your other infrastructure metrics.
Use Cases
- AI/ML Workloads: Monitor GPU utilization during training and inference
- Capacity Planning: Track memory usage patterns over time
- Alerting: Set up Prometheus alerts for temperature or utilization thresholds
- Multi-GPU Systems: Monitor all GPUs from a single dashboard
Get the Code
Repository: smarttechlabs-projects/strix-halo-rocm_info
Contributions welcome—whether it’s additional metrics, UI improvements, or documentation.
Need custom monitoring solutions for your AI infrastructure? Let’s talk.
SmartTechLabs
Building Intelligent Solutions: IoT, Edge Computing, AI & LLM Integration
Related Articles
Fixing ROCm Boot Issues: amdgpu Module Blacklisted
The Problem After installing ROCm on a fresh Linux system, you reboot and… your AMD GPU …
Read moreRunning ComfyUI on AMD Ryzen AI Max 395 (Strix Halo)
The Challenge AMD’s Ryzen AI Max 395 (Strix Halo) represents a new era in APU computing with …
Read moreInstalling LM Studio with Vulkan Support on AMD Strix Halo
Local LLMs on Strix Halo AMD’s Ryzen AI Max 395 with its massive unified memory pool is an …
Read more